


A Gantt diagram is one of those tools that quietly raises an organization’s efficiency without demanding new strategy, new budget, or new team: it simply makes work visible. At today, the real challenge is not having tasks, but coordinating time, costs, and resources so that projects actually support strategic goals.
That is the practical outcome of a Gantt chart: it turns a project into a shared timeline that everyone can understand. It shows what must be done, when it should happen, who is responsible, and how far the work has progressed. What might look complex at first is, in reality, an intuitive map: horizontal bars across a calendar. Once the map exists, the Project Manager can spot delays early, discuss trade-offs with stakeholders, and keep the team aligned, without relying on constant meetings or vague status updates.

Description and formulas
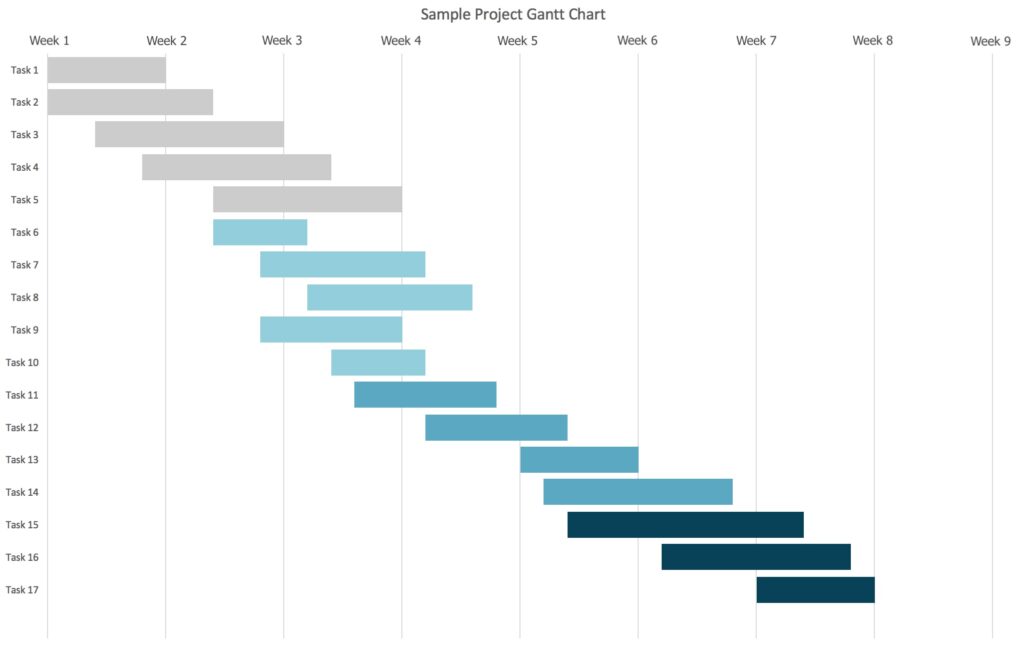
The Gantt diagram is a two-part visual tool that represents project activities along a time axis. On the left it lists tasks, on the right it displays them as horizontal bars positioned on a timeline: the length of the bar equals the time required to complete the activity.
A typical Gantt includes:
- Project dates: the overall start and end date.
- Activities (tasks): a project is broken into sub-activities, each becomes a bar.
- Project timing: estimated duration for each task, used to check whether execution matches the plan.
- Dependencies: relationships between tasks (some can start anytime; others require prior completion).
- Progress status: an indicator of what’s done vs. what remains.
Many Gantt charts also highlight milestones as intermediate checkpoints that confirm on-run results, such as approval of a deliverable, a review meeting, or a release date.
A Gantt chart is visual, but it relies on clear time calculations, with simple planning equations. Let each task i have:
- Start date/time Si
- Duration Di
- Finish date/time Fi
Then: Fi =Si +Di
Dependencies constrain starts. For example, if task j cannot start until task i finishes (finish-to-start dependency), then: Sj ≥ Fi
When multiple predecessors exist, the earliest feasible start is driven by the latest predecessor finish: Sj =max (Fp1 ,Fp2 ,…)
Progress is often tracked as a percentage:
Planned duration completed: pi (0–100%)
Remaining time: Ri =(1−pi)⋅Di
Even if your software hides these calculations, this is the managerial backbone: dates, durations, constraints, and progress.
How to build a Gantt (4-step method). A practical approach is:
- List activities and define the time window: clarify project start/end and estimate timelines based on available resources.
- Define dependencies: identify which tasks require earlier tasks to finish, especially in complex projects.
- Build the timeline and milestones: include buffer awareness, delays happen; milestones create control points.
- Create the chart: a basic table often starts with Task, Start date, Duration, then turns into a stacked bar chart.
Main use
The main business use of a Gantt diagram is planning + execution control + communication in one artifact.
- Planning: it helps allocate resources realistically, prioritize important tasks, and create a credible timeline that supports strategic objectives.
- Control during execution: it makes deviations visible—if a bar “slides” right, you can act early (re-assign resources, re-sequence tasks, negotiate scope) instead of discovering problems at the deadline.
- Stakeholder alignment: it provides clarity to management and clients about what and when is happening, improving trust and reducing reporting.
- Team performance: people understand responsibilities and how their work impacts the whole project, improving accountability and motivation.
- Negotiation tool: it supports evidence-based discussions about bottlenecks, overload, and trade-offs—using the shared reference of tasks and timing.
- Multi-project management: by standardizing how timelines are viewed, it becomes easier to coordinate several initiatives without overloading key resources.