


Break Even Point (BEP), is the moment a business stops just surviving and starts creating value. It marks the point where revenues and costs finally meet: no profit, no loss: simply balance. For an entrepreneur, that balance is not a theoretical curiosity; it’s a practical milestone. For an entrepreneur, BEP indicates, in very concrete terms, how much must be produced and sold to cover costs, and for this reason it’s considered a KPI (Key Performance Indicator): it sets a minimum performance threshold.
Before getting Break-Even Point, the Company is absorbing resources: after that, every additional sale can generate profit. In early-stage ventures, it supports “go/no-go” decisions and makes a business plan more realistic. In ongoing operations, it becomes a friendly but strict compass: it keeps attention on volumes, pricing, and cost discipline, so surprises in profitability become less frequent and less damaging.

Description and formulas
To calculate Break-Even, three business drivers must be connected: costs, revenues, and production/sales volumes. The first step is to analyze total costs and split them into two families:
- Fixed Costs (FC): costs the company bears regardless of production volume. Whether you produce 10 units or 1,000, these costs remain the same (at least in the short run). Examples: rent, salaried wages, accounting and tax consultancy.
- Variable Costs (VC): costs that rise or fall with the quantity produced. Examples: raw materials, energy consumption tied to production, third-party supplies directly linked to output.
From here, BEP can be found through three common methods.
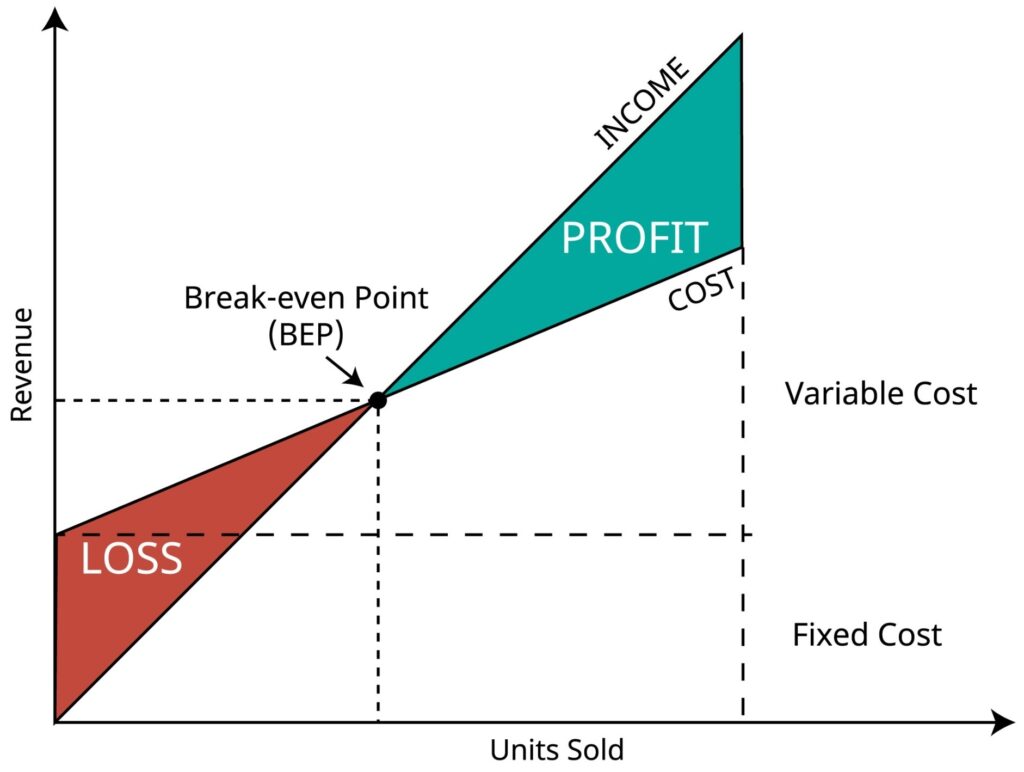
Graphic method (profitability chart)
In the graphical approach, volumes are placed on the X-axis (units produced/sold) and costs/revenues on the Y-axis. Fixed costs appear as an horizontal line, variable costs rise with volume, creating total costs. Total revenues rise with volume based on selling price. The intersection point between total revenues and total costs is the Break Even Point: below it, the business operates at a loss; above it, it produces profit.
This visual approach is straight in management discussions because it makes the “loss zone” and “profit zone” well visible and intuitive.
Analytical method (core formula)
The analytical method uses a direct equation. Let:
FC =fixed costs
USP =unit selling price
UVC =unit variable cost
Then the break-even volume (in units) is:
BEP = FC / (USP−UVC)
The term (USP−UVC) is the contribution margin per unit: it represents how much each unit contributes toward covering fixed costs. When a company sells multiple products, this calculation should be done per single product (or by using a weighted average contribution margin based on the sales mix).
As example:
Fixed Costs are €90,000, unit price is €500, and unit variable cost is €200:
BEP = 90,000 / (500−200) =90,000 / 300 =300 units
So the company must produce and invoice 300 units to Break Even. Fewer than 300 means losses, more means profits.
Proportional method (using a fixed margin %)
If the business already works with a stable gross margin percentage on sales, BEP can be estimated in revenue terms. If margin is m%, then:
Break-even revenue = Fixed Costs / m%
As example: fixed costs €700,000, margin 40%:
(700,000 / 40) * 100 = 1,750,000
This revenue level covers variable costs (the remaining 60%) plus fixed costs.
Main use
BEP is both a control tool and a risk forecasting tool. It highlights the minimum revenue level the firm must achieve to avoid losses, making it valuable in budgeting and business planning, alongside other risk-related approaches like NPV/VAN and WACC.
Operationally, BEP supports a simple decision rule: if forecast sales are below Break-Even, the concept should be reconsidered, if forecast sales are likely above it, the project becomes economically sustainable. This is particularly useful when launching a new product: fixed costs may stay stable, meanwhile variable costs increase, and BEP helps test whether pricing is optimal and whether market demand can realistically support it.
Management can also act on BEP through three levers:
- Reduce fixed costs (often difficult, but impactful).
- Reduce variable costs (suppliers, waste reduction, process efficiency).
- Increase selling price (only if the market can accept it).
BEP’s limit is static snapshot: does not model cash flow timing, assumes produced units equal sold units (ignoring inventory), may treat costs and revenues as linear when they aren’t, and does not directly incorporate competitive pricing dynamics. Accordingly, BEP works best as a clear baseline, to be reviewed and recalculated as conditions change.